Graphics in Cricket Broadcasts Illuminate Session Market Possibilities
Written by Katja Walter · Sep 8, 2026
Graphics in Cricket Broadcasts Illuminate Session Market Possibilities
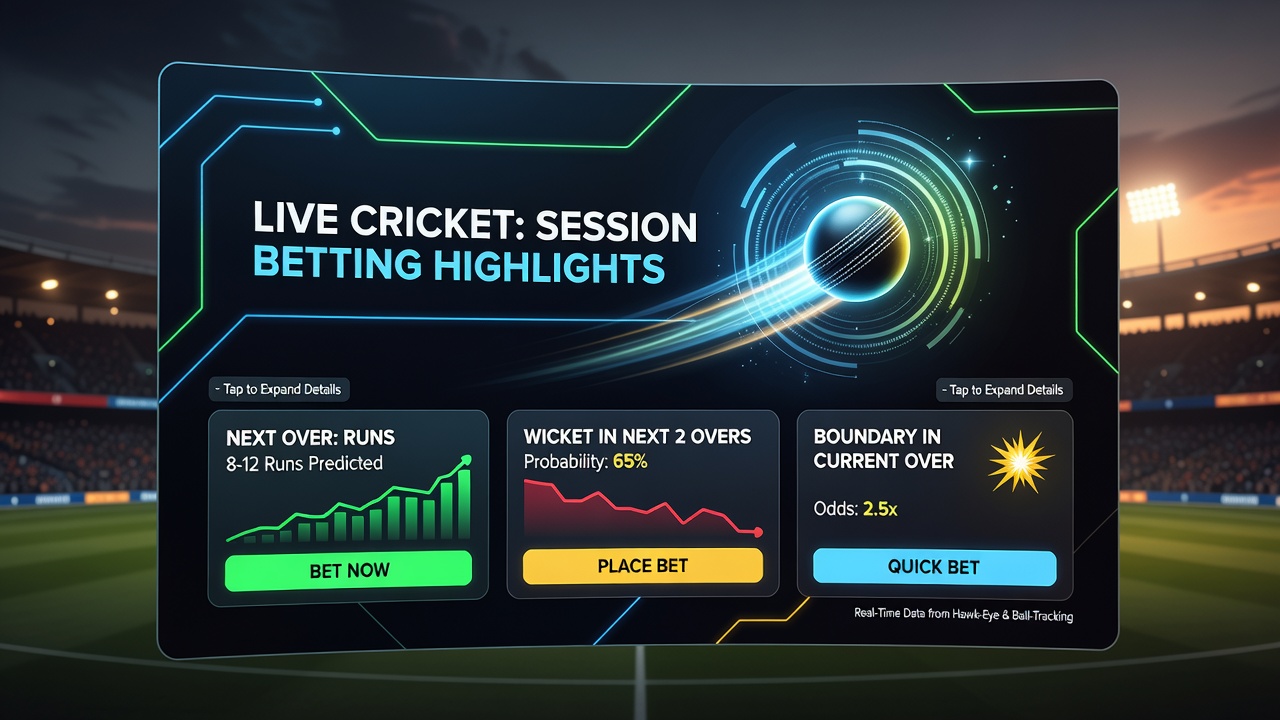
Cricket broadcasters have incorporated interactive graphics into live transmissions to display session betting markets, allowing viewers to track over-by-over and powerplay opportunities alongside match footage. These visual elements appear during international and domestic fixtures, presenting real-time data on current odds for segments such as the first 10 overs or specific wicket tallies. Data from the International Cricket Council shows increased integration of such overlays across major events held through 2026, with September schedules featuring extensive T20 and Test coverage that incorporates these tools.
Development of Visual Tools in Cricket Coverage
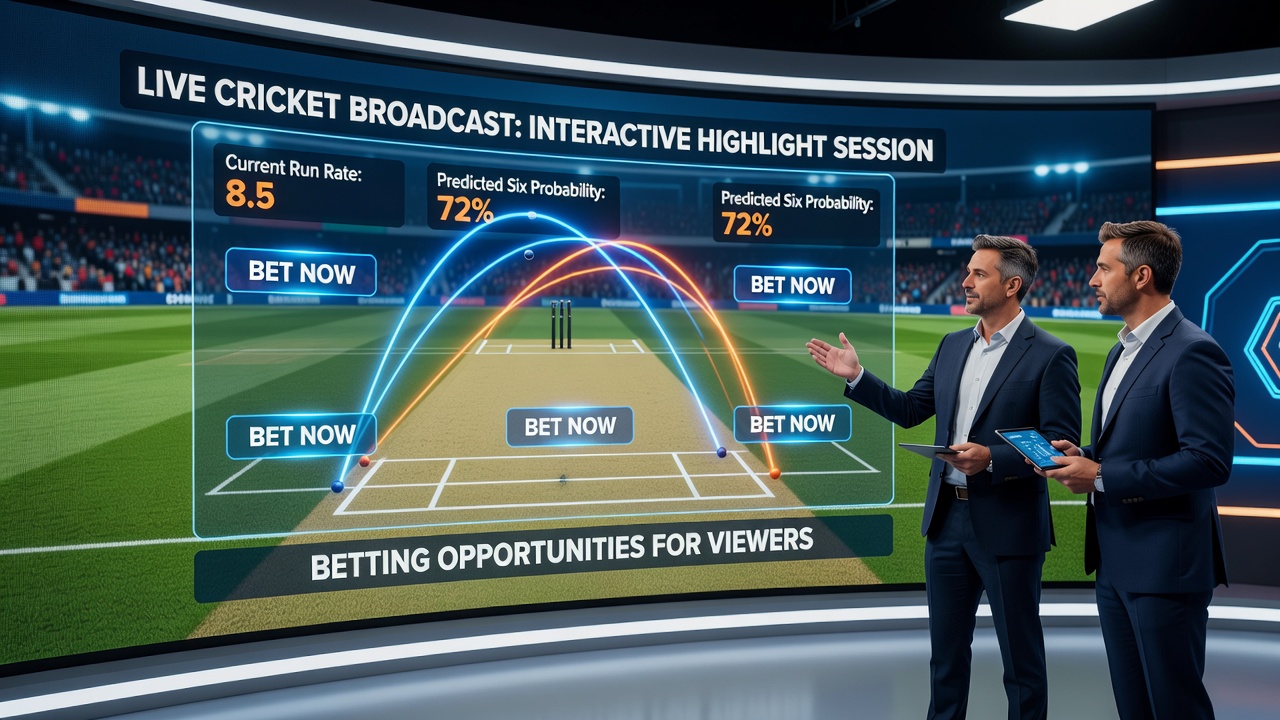
Production teams at networks covering cricket matches began experimenting with dynamic graphics in the mid-2010s, initially focusing on player statistics and ball trajectories. By 2020 the systems evolved to include betting-related information, drawing from partnerships with data providers that supply live odds feeds. Observers note that these additions coincide with broader adoption of augmented reality elements in sports telecasts, where viewers in regions like Australia and India encounter pop-up windows showing session outcomes without interrupting play.
Engineers design the interfaces to update automatically as wickets fall or runs accumulate, using algorithms that calculate implied probabilities for remaining overs in a session. Broadcasters such as those handling IPL and international series feed this information directly into on-screen tickers that viewers can toggle via remote or app controls. Research conducted at Loughborough University on sports media technology indicates that such features help audiences follow multiple data streams simultaneously during extended formats like Test matches.
Session Markets Featured Through Overlays
Session betting centers on discrete portions of an innings, typically divided into morning, afternoon, or evening periods in Tests, or powerplay and middle-over blocks in limited-overs games. Interactive graphics highlight these divisions by showing projected totals, most likely wicket takers, and boundary counts for the current segment. Viewers see color-coded bars that shift when a batsman reaches a milestone or when field placements change, reflecting updated market conditions.
One study from the University of Melbourne examined how these visuals affect engagement during Australian summer series, finding that on-screen prompts for session-specific wagers appear most frequently between overs. The graphics often include player performance metrics tied to betting options, such as strike rates during the first six overs or economy figures for bowlers in death overs. This presentation style keeps information concise while covering the range of available markets.
Technical Implementation Across Regions
Production workflows differ by territory yet share common components. In Europe and Asia, satellite feeds integrate graphics layers that activate during designated broadcast windows, while North American coverage relies on streaming platforms to deliver similar overlays. The Cricket Australia broadcast team, for instance, coordinates with technology vendors to ensure graphics refresh at intervals matching ball-by-ball updates from the official scoring system.
Regulatory frameworks in various jurisdictions address how such content reaches audiences. The Australian Communications and Media Authority oversees broadcast standards that include provisions for commercial overlays, requiring clear separation between editorial footage and promotional elements. Similar guidelines from the Canadian Radio-television and Telecommunications Commission apply to sports channels carrying cricket content, emphasizing transparency in displayed data sources.
Audience Interaction and Data Presentation
Viewers access additional details through second-screen applications that sync with the main broadcast. These apps allow selection of specific session markets, with graphics on the primary feed highlighting the chosen option. Figures from industry reports compiled by the Sports Broadcasting Association reveal that cricket audiences in multiple markets spend extended periods engaging with these interactive features during high-profile series.
Graphics designers prioritize readability, using large fonts and contrasting colors to ensure updates remain visible even on smaller screens. When a session concludes, summary panels appear that recap key statistics and final market settlements. This approach maintains continuity between live action and post-session analysis segments.
Conclusion
Interactive graphics have become a standard component of live cricket broadcasts, providing structured displays of session betting opportunities alongside match developments. Implementation varies by region and follows established technical and regulatory practices, with data sources drawn from official scoring systems and approved providers. Coverage through September 2026 continues to feature these elements across major tournaments, supporting viewer access to real-time market information during ongoing play.