Broadcast Graphics Highlight Momentum Indicators Shaping Basketball Spread Adjustments
Written by Quinn Peters · Aug 22, 2026
Broadcast Graphics Highlight Momentum Indicators Shaping Basketball Spread Adjustments
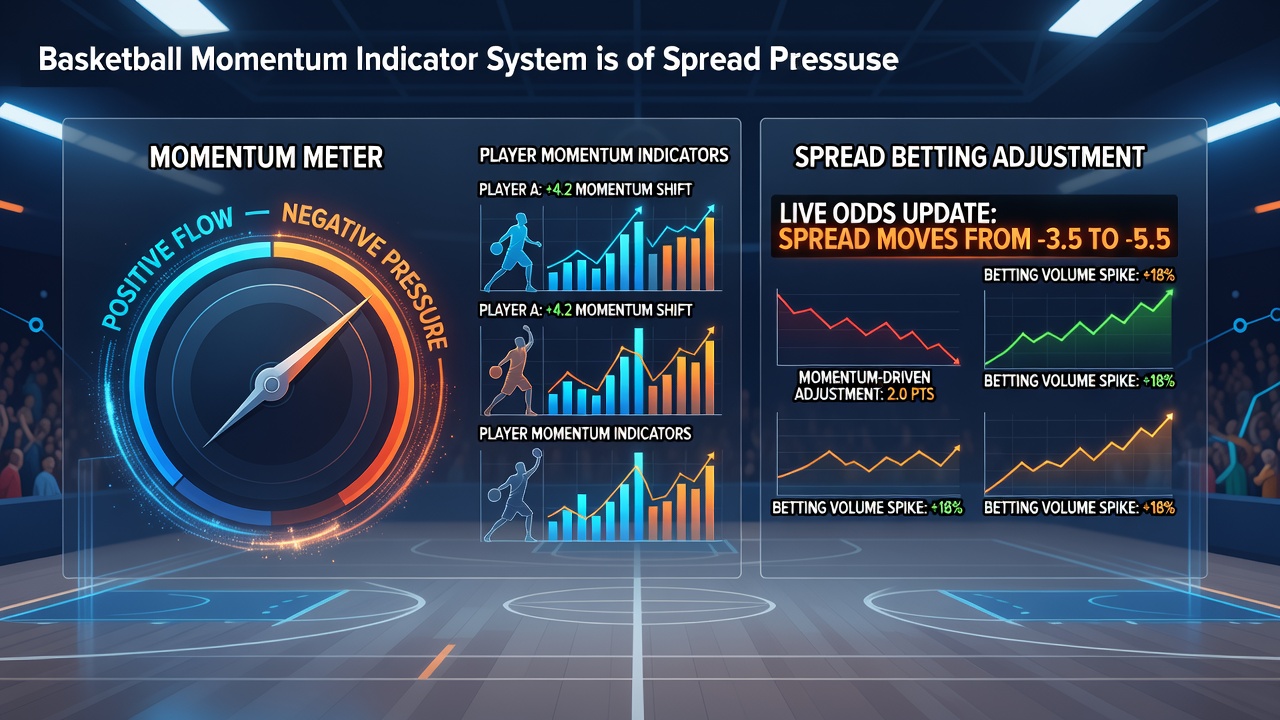
Television productions for professional basketball games have incorporated layered graphics that track running efficiency ratings, possession momentum scores, and defensive pressure indexes, all of which feed directly into live spread calculations used by bettors. Networks began rolling out these overlays in early 2025, and by August 2026 multiple leagues had standardized the displays across national and regional feeds. The indicators combine player tracking data with historical performance baselines, producing a single momentum value that updates after every made basket or turnover.
Core Components of the New Graphics Packages
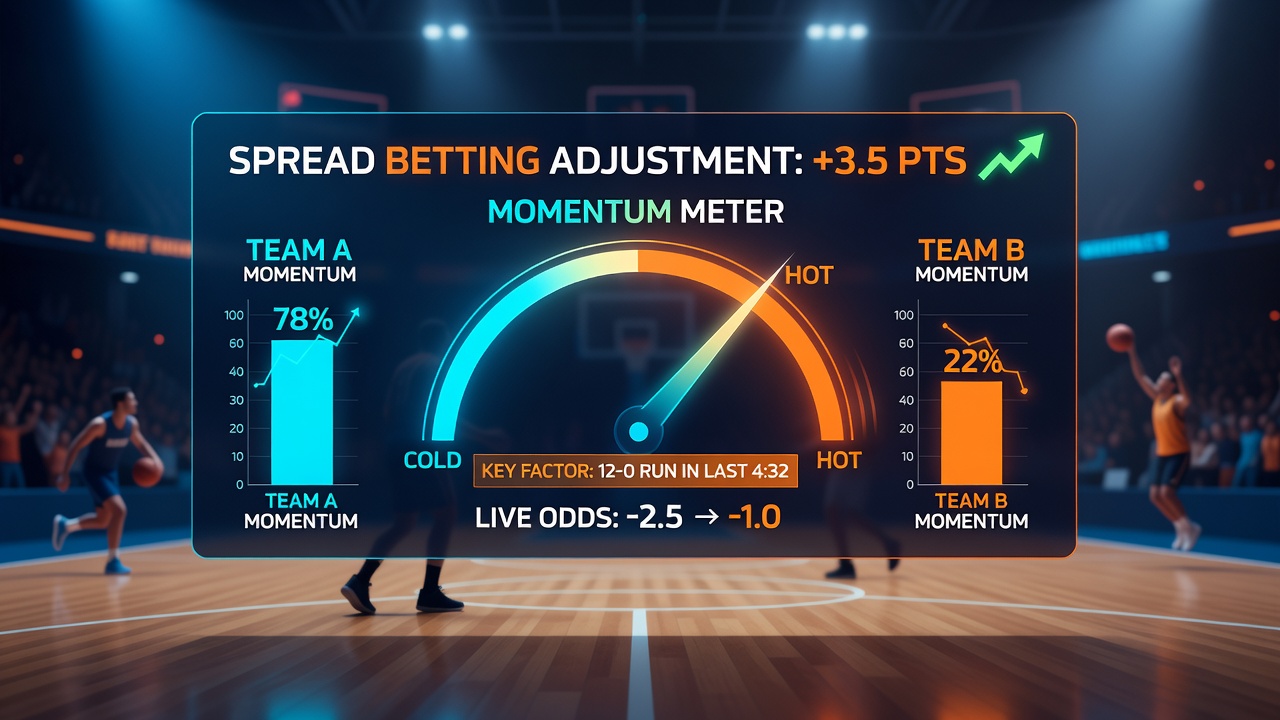
Production teams pull raw coordinates from league optical systems and feed them into proprietary algorithms that calculate a momentum index on a scale from zero to one hundred. A rising index appears as a green bar that lengthens across the bottom of the screen while a falling index shifts to red and contracts. Color-coded zones also mark when the index crosses thresholds that historically correlate with point-spread movement of more than one point within the next five minutes of play. Broadcasters synchronize these visuals with side-panel statistics that list the current spread, the live total, and the implied probability derived from the momentum reading.
Analysts working inside the trucks receive the same data stream and can trigger on-screen callouts when a team’s momentum index deviates sharply from its season average. These callouts include brief text overlays noting the exact possession count and the defensive rating that drove the shift. Viewers therefore see both the raw numbers and a simplified visual cue at the same moment the betting markets adjust their lines.
Data Integration and Betting Market Response
Bookmakers licensed in multiple jurisdictions now ingest the identical momentum feeds through licensed data partners. When the on-screen index jumps fifteen points or more, automated pricing engines widen or narrow the spread within seconds. A study released by the American Gaming Association in mid-2026 documented that spreads moved an average of 1.4 points within ninety seconds after a momentum graphic update during nationally televised games. The same report linked the timing of those adjustments to increased in-game betting volume during the final six minutes of each quarter.
Regional sports networks have adopted similar packages for college conference games, although the data sources remain less granular than NBA feeds. Conferences such as the Big Ten and the ACC supply basic possession data that still allows production teams to generate a simplified momentum bar. Bettors following those contests report using the graphics to time live wagers on second-half spreads, particularly when a team’s index climbs above seventy while the opponent’s drops below thirty.
Viewer Tools and Accessibility Features
Streaming platforms that carry the same games now offer optional second-screen dashboards that mirror the broadcast graphics. Users can toggle between the full momentum index and individual player efficiency ratings. The dashboards pull from the same league data pipeline, ensuring consistency between television and mobile displays. Accessibility options include audio descriptions that read the current momentum value aloud at set intervals, allowing visually impaired bettors to follow changes without staring at the screen.
League rules adopted in 2025 require that any graphic containing betting-related information must also display a clear disclaimer directing viewers to responsible gambling resources. The disclaimer appears in the same font size as the momentum number and remains on screen for a minimum of four seconds after each update.
Impact on In-Game Decision Making
Coaches and front-office personnel have begun referencing the same momentum graphics during timeouts, although they receive the raw data through private league portals rather than the public broadcast. One documented case from the 2025-2026 season showed a Western Conference team adjusting its defensive scheme after the momentum index indicated a sustained drop in transition efficiency. The adjustment coincided with a reversal in the live spread that lasted through the remainder of the third quarter.
Academic researchers examining play-by-play files from the same season found that teams trailing by five or fewer points at the moment their momentum index crossed fifty experienced a statistically measurable increase in three-point attempt rate during the subsequent two minutes. The finding appears in a working paper issued by the University of Michigan’s Center for Sports Analytics and has prompted several teams to incorporate similar thresholds into their in-game analytics dashboards.
Conclusion
Basketball broadcast graphics have evolved from simple score bugs into integrated data layers that directly inform both viewer understanding and live spread adjustments. The momentum indicators displayed on screen now serve as a shared reference point for broadcasters, bettors, and team staff alike. As additional leagues adopt standardized tracking and display protocols, the alignment between on-air visuals and market movements is expected to tighten further through the remainder of 2026.